Applied Fieldwork
Types of Data
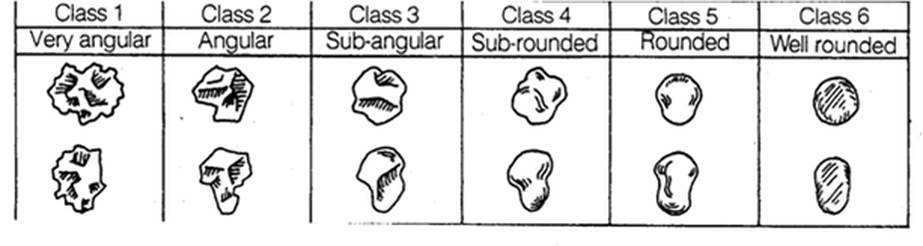
Qualitative Data - Is data that is your opinion e.g. shape of sediment ( pebbles) found on the beach
Quantitative Data - Is data in it's numerical form (facts and figures) e.g. the angle of the sloping beach
Qualitative Data - Is data that is your opinion e.g. shape of sediment ( pebbles) found on the beach
Quantitative Data - Is data in it's numerical form (facts and figures) e.g. the angle of the sloping beach
|
Types of Data Collection
Primary Data - is the type of data collection that you do your self first hand e.g. plotting data in a table of results Secondary Data - is data collected by someone else that is used by the person doing the data collection e.g. an aerial photograph or a map |
Terms of Data Collection
Random Data - is the type of data obtained randomly e.g. a random number of metres to measure the angle of the beach. It can be obtained by random number generation.
Stratified Data - is the type of data that is put into categories e.g. the types of cliffs can be grouped by the type of rock that makes them up. It can be obtained by finding all the things in one category and plotting them in a table. E.g. find all the cliffs in Highcliffe and plot them in a table based on which type of rock forms them.
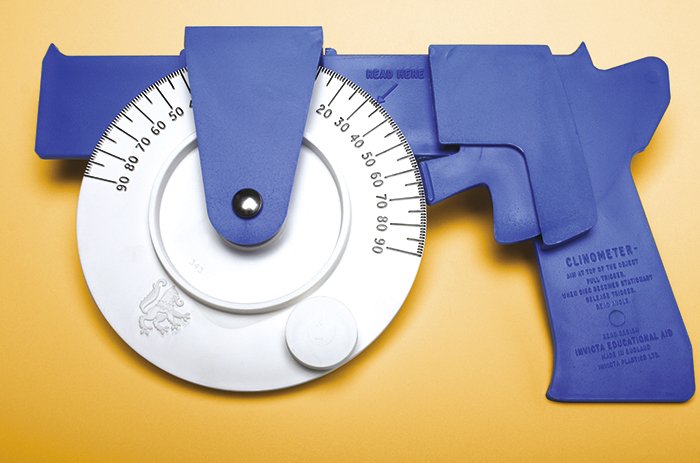
Systematic Data - is the type of data collected at regular intervals. E.g. on the field trip to Highcliffe, we measured 3 metres along the width of the beach, and at each 3 metre interval we used a gun clinometre to measure the angle of the sloping beach.
Random Data - is the type of data obtained randomly e.g. a random number of metres to measure the angle of the beach. It can be obtained by random number generation.
Stratified Data - is the type of data that is put into categories e.g. the types of cliffs can be grouped by the type of rock that makes them up. It can be obtained by finding all the things in one category and plotting them in a table. E.g. find all the cliffs in Highcliffe and plot them in a table based on which type of rock forms them.
Systematic Data - is the type of data collected at regular intervals. E.g. on the field trip to Highcliffe, we measured 3 metres along the width of the beach, and at each 3 metre interval we used a gun clinometre to measure the angle of the sloping beach.
Transect
A transect is required to systematically sample through an environmental gradient. Transects can be of many types, with the most common being a line transect (sampling along a line).
A transect is required to systematically sample through an environmental gradient. Transects can be of many types, with the most common being a line transect (sampling along a line).
Field Trip
Field Trip to Highcliffe Hypothesis
Longshore drift moves sediment from west to east
Longshore drift moves sediment from west to east
Graph to show Results from Field Trip
Field Trip to Highcliffe
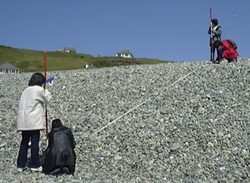
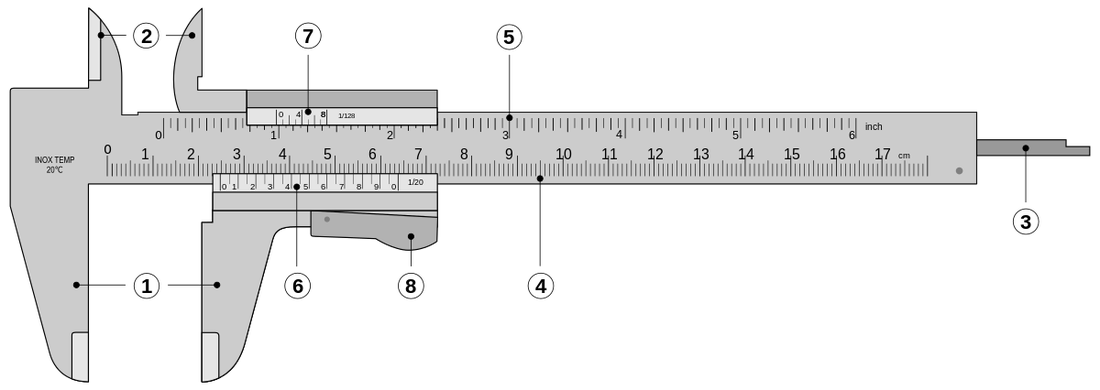
On the field trip to Highcliffe, we drew a line transect along the beach with a tape measure. We then divided the tape measure up into 3 metre intervals, putting rocks at each interval. Once the whole tape measure was divided up, we put a ruler at one of the intervals, facing upwards, and we used the gun clinometre to measure the angle of the beach making sure the nearest sight of the measuring tool was flat on the ruler and the end sight was aiming at the top of the sloping beach. We then recorded the results for this angle and then repeated on the next interval and continued until there was no tape measure left. Also, we measured the volume and size of the pebbles, using a jug of sea water to measure the volume and a caliper to measure the size. We put the pebbles into the jug and whatever the jug of water increased by in ml, was the volume of the pebble in cm^3. We recorded this volume in a table. When we measured the size of the pebbles, we closed a caliper down so that it was just touching the pebbles edges. This gave a precise reading in mm of what the size of the rock was. We recorded this size and then went on to measure the other two sides, (either length, height or width). This would then give us a prediction on what the volume of the pebble could be. Then we would put the pebbles into categories (e.g. angular, very angular, etc.). Overall, we measured 4 different pebbles at 3 metre intervals, so we could get an average of the pebbles' size and volume at that selected distance away from the sea.
On the field trip to Highcliffe, we drew a line transect along the beach with a tape measure. We then divided the tape measure up into 3 metre intervals, putting rocks at each interval. Once the whole tape measure was divided up, we put a ruler at one of the intervals, facing upwards, and we used the gun clinometre to measure the angle of the beach making sure the nearest sight of the measuring tool was flat on the ruler and the end sight was aiming at the top of the sloping beach. We then recorded the results for this angle and then repeated on the next interval and continued until there was no tape measure left. Also, we measured the volume and size of the pebbles, using a jug of sea water to measure the volume and a caliper to measure the size. We put the pebbles into the jug and whatever the jug of water increased by in ml, was the volume of the pebble in cm^3. We recorded this volume in a table. When we measured the size of the pebbles, we closed a caliper down so that it was just touching the pebbles edges. This gave a precise reading in mm of what the size of the rock was. We recorded this size and then went on to measure the other two sides, (either length, height or width). This would then give us a prediction on what the volume of the pebble could be. Then we would put the pebbles into categories (e.g. angular, very angular, etc.). Overall, we measured 4 different pebbles at 3 metre intervals, so we could get an average of the pebbles' size and volume at that selected distance away from the sea.
.Conclusion
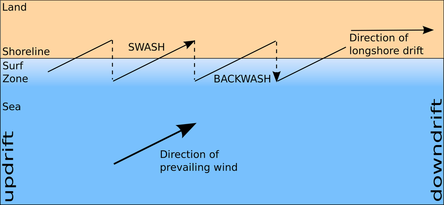
To conclude, we can see clearly from the graphs that Highcliffe's beach sediment, (sand and shingle), moves from west to east. This is shown by Transect group 1 having a beach height of 4m, whereas Transect group 2 has a beach height of 7.5m. Transect group 2 was further east than Transect group 1. This movement of sediment is due to Longshore drift which is caused by waves approaching the coastline at an angle. Then, Swash carries sediment up the beach at an angle. This is caused by the direction of the prevailing wind. After this, Backwash carries sediment down the beach with gravity (at right angles to the beach.) This creates a zig-zag movement of sediment along the beach. Sometimes, the prevailing wind changes in direction. This will caused a hooked end on the end of spit or headland. Longshore drift is shown clearly by the diagram.
To conclude, we can see clearly from the graphs that Highcliffe's beach sediment, (sand and shingle), moves from west to east. This is shown by Transect group 1 having a beach height of 4m, whereas Transect group 2 has a beach height of 7.5m. Transect group 2 was further east than Transect group 1. This movement of sediment is due to Longshore drift which is caused by waves approaching the coastline at an angle. Then, Swash carries sediment up the beach at an angle. This is caused by the direction of the prevailing wind. After this, Backwash carries sediment down the beach with gravity (at right angles to the beach.) This creates a zig-zag movement of sediment along the beach. Sometimes, the prevailing wind changes in direction. This will caused a hooked end on the end of spit or headland. Longshore drift is shown clearly by the diagram.
Equipment Used
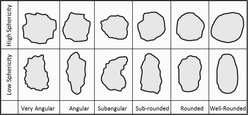
Pebble Recognition Chart
Caliper
Gun Clinometer
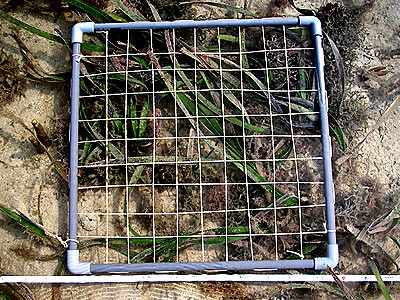
Transect Square
Metre Rule
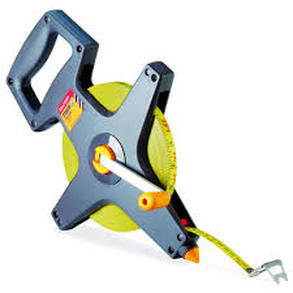
Tape Measure